
2023 annual report – highlights
Many new opportunities took root in 2023 in all pillars of the CCC’s strategic plan, including:
- Growing diversification into biofuels markets
- Renewing investment in research, and market access and development
- Establishing resources in the Indo-Pacific region
- Revitalizing connections with China and other key markets
- Learning more about canola agronomy in the brown soil zone
- Facilitating innovation in plant breeding and crop protection products
Download the PDF:
Growing Opportunity, 2023 Annual Report
View the flipbook online:
Growing Opportunity, 2023 Annual Report
Partnership across the value chain
The Canola Council of Canada involves all parts of the value chain, including canola growers, processors, life science companies and exporters. We all sit down at the same table to discuss and advance our collective success.
Our strategic priorities
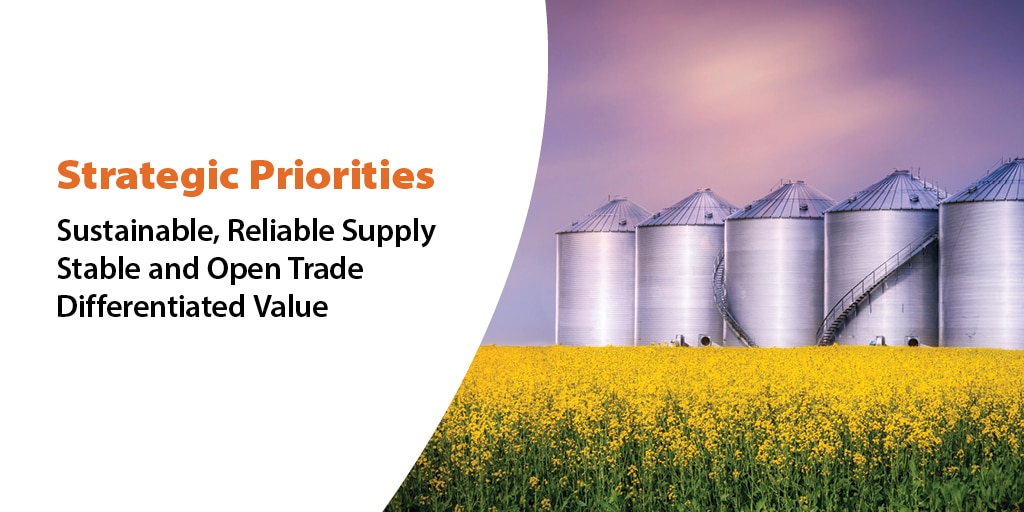
We move forward guided by the three strategic priorities of the industry’s Keep it Coming 2025 strategic plan:
Sustainable, reliable supply
Meeting growing global demand for Canadian canola while increasing the economic and environmental benefits of every acre
Differentiated value
Demonstrating the quality characteristics of canola seed, oil and meal
Stable and open trade
Creating a trade environment that consistently allows the industry to attain maximum value for canola
The year at a glance
| wdt_ID | Targets | 2023 Results | 2025 Target | 3-YR Average (2020-2022) |
|---|---|---|---|---|
| 1 | Exported Seed | 7.1 MMT | 12 MMT | 8.6 MMT |
| 2 | Domestic Processing | 10.5 MMT | 14 MMT | 9.6 MMT |
| 3 | Acres (Seeded Area) | 22.1 million | 22 million | 21.5 million |
| 9 | Yield | 36.9 bu/acre | 52 bu/acre | 36.3 bu/acre |
| 10 | Production | 18.3 MMT | 26 MMT | 17.5 MMT |
| 11 | Oil Content (Average of No. 1 Grade) | 43.2% | Maintain global competitiveness in oil content (10 yr average = 43.8%) | 42.5% |
| 12 | Saturated Fat Content | 6.6% | Global leadership position in oil saturated fat content | 6.7% |
| 13 | Meal Crude Protein Content (Oil-free, 12% moisture basis) | 39.5% | Increase protein availability by target species (10 yr average = 38.7%) | 40.2% |
MMT = Million Metric Tonnes
All statistics are for 2023 calendar year
Sources: Statistics Canada, Canadian Grain Commission